<html> <style type=“text/css”> .comment { font-style: italic; color: #c0342d; } .name, .variable, code var, pre var { color: #9e5cb1; } .name { font-weight: bold; } .variable, pre var, code var { font-style: italic; } .keyword { color: #abafb3; } .builtin, .string { color: #417fb8; } .constant { color: #e89f27; } code, code.pyret { color: black; } table { margin: 1em auto; } table th, table td { padding: 1pt 4pt; font-size: 13pt; } div.dw-content a { text-decoration: underline; } div.dw-content p, div.dw-content li, div.dw-content li p { font-size: 13pt; max-width: 750px; }
div.dw-content p+p, div.dw-content li+li, div.dw-content p+li, div.dw-content li + p { margin-top: 1em; }
div.dw-content ul li ul li { margin-top: 1em; } div.task { max-width: 750px; } p code, li code { font-size: 11pt; } blockquote { font-size: inherit; } pre kbd, code kbd { background: inherit; color: inherit; box-shadow: none; padding: 0; font: inherit; font-weight: bold; } a.secret { color: inherit; text-decoration: none !important; } a.secret:hover { text-decoration: underline !important; } ol li div.task p:first-child {
margin: 0;
} div.task, p.task {
  background-color: #f2d4d7 !important;
  border: 1px solid #6366a !important;
  padding: 1em 2.25em;
  margin: 2em 1.5em;
} p.task, div.task p:first-child {
text-indent: -1.5em;
}
blockquote {
  border: 0;
  margin: 1.5rem;
}
img { max-width: 100%; max-height: 800px; border: 1px solid black; } div.task img { max-width: 110%; } </style>
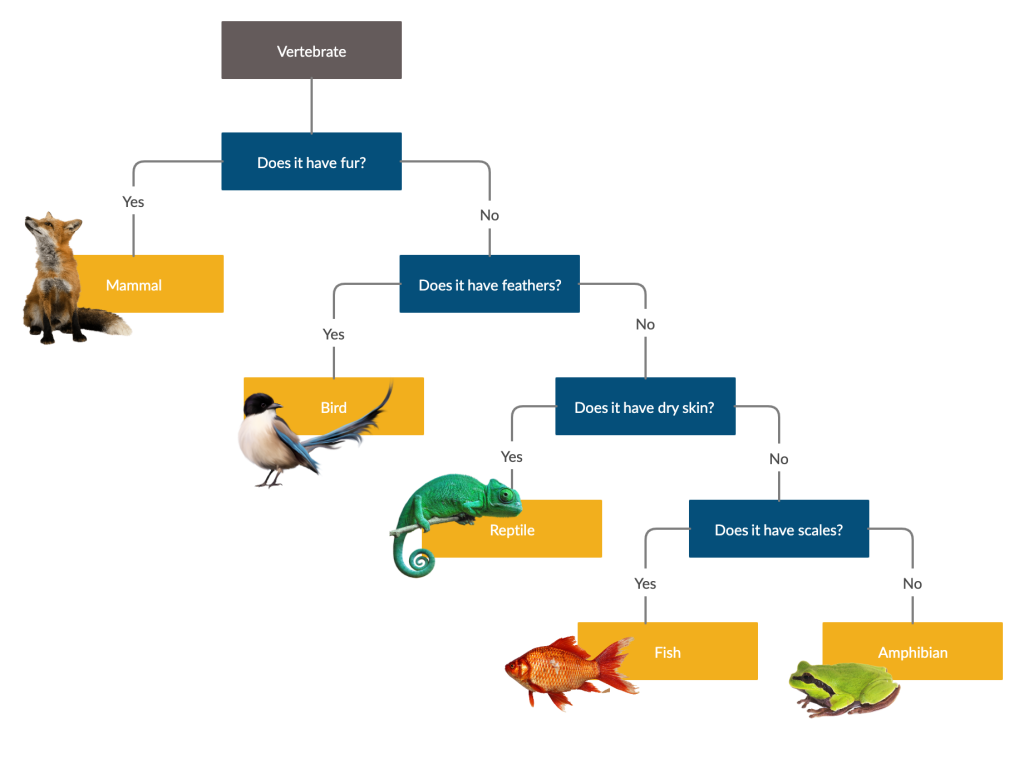
<h1 id=“assignment-6-decision-trees”>Assignment 6: Decision Trees</h1> <p><strong>Assigned</strong>: Thursday, 27 October <br /> <strong>Due</strong>: Wednesday, 2 November, 11:59 p.m.</p> <h2 id=“introduction”>Introduction</h2> <p>This week we learned about <em>trees</em>, which can be used to represent data such as ancestry (a family tree) or the spread of (mis)information through a social network. But trees can also be used for designing programs that classify other data – this is the machine-learning model called a <em>decision tree</em>.</p> <p>You can think of a decision tree as a series of questions that lead to an answer, e.g.,</p>
<blockquote> <p><img src=“https://www.cs.vassar.edu/~cs101/images/animal-tree.png” /></p> <p>Source: <a href=“https://creately.com/blog/diagrams/what-is-a-dichotomous-key”>Creately</a></p> </blockquote>
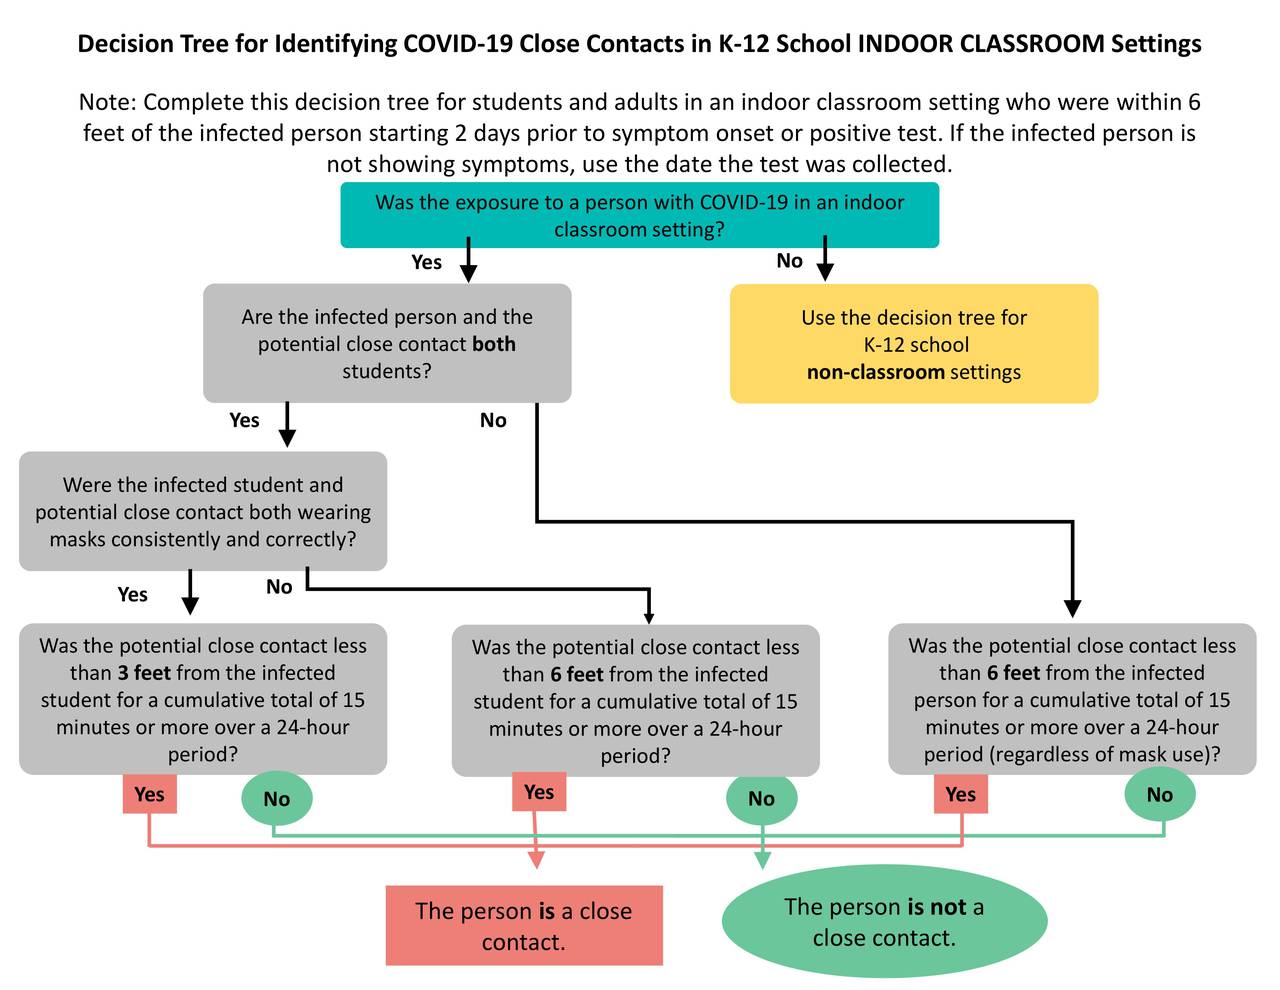
<p>In this case, the questions lead to a possible classification of an animal. You may have also seen more serious examples, such as this decision tree about whether someone should be considered a close contact for Covid-19:</p> <blockquote> <p><img src=“https://www.cs.vassar.edu/~cs101/images/close-contact.jpg” /></p> <p>Source: Jessica Gould, “<a href=“https://gothamist.com/news/you-have-questions-about-nycs-new-school-quarantine-rules-we-have-answers”>You Have Questions About NYC’s New School Quarantine Rules. We Have Answers.</a>”, <em>Gothamist</em>, 2021</p> </blockquote> <p>This assignment uses very simple notions of what machine learning does, but it’s enough to give you the core idea: We have data on what has happened in the past, and we use statistics about it to make decisions about new situations. (If you take a machine learning class, you will learn how to handle more complex notions of similarity between old and new cases, and more nuanced algorithms for deciding what to do based on the data.)</p> <p>This is our last Pyret assignment, and it pulls together many of the concepts we’ve studied.</p> <h2 id=“problem-and-data”>Problem and data</h2> <p>The medical workers in a town where malaria risk is high want to distribute <a href=“https://www.cdc.gov/malaria/malaria_worldwide/reduction/itn.html”>insecticide-treated bed nets</a>, which help prevent the spread of the disease. Since they have a limited budget, they can only distribute nets to the people who are most at risk. To make these decisions, they want to use machine learning on data about people in the town, including</p> <ul> <li>the distance of their home from a lake,</li> <li>their age, and</li> <li>whether they are pregnant.</li> </ul> <p>Living close to a lake is associated with increased risk of malaria, and children and pregnant people both have less immunity to malaria and are therefore more susceptible.</p> <p>To help them build this system, the medical workers have data about people from a similar town, including whether those people contracted malaria.</p> <p>As we’ve done in the past, we’ll load this data from <a href=“https://docs.google.com/spreadsheets/d/1uUGUbMpklR00AEZVjrcLiAQHCplxk3Eul4CJNQ8rlvg”>a Google spreadsheet</a>. Note that the data has been divided into two sheets:
train-data
, which we’ll use in order to learn who to give bed nets to, and
test-data
, which we’ll use to evaluate how well the resulting system does at making these decisions.</p> <h2 id=“guidelines”>Guidelines</h2> <ul> <li>Do not change the name of the file or the functions.</li> <li>Remember to test your functions thoroughly and to write your code clearly. Your work will be graded on clarity and thorough testing, as well as on whether it works correctly.</li> <li>Remember your resources: <ul> <li><a href=“https://www.cs.vassar.edu/~cs101/3/resources/tables.html”>Table documentation</a></li> <li><a href=“https://www.cs.vassar.edu/~cs101/3/resources/pyret.html”>Code clarity guide</a></li> <li>Coaches</li> <li>Your instructor</li> </ul></li> </ul> <h2 id=“part-1-making-and-using-a-decision-tree”>Part 1: Making and using a decision tree</h2> <p>In this first part, we’ll look at the structure of our decision trees and complete the assembly of a decision tree. We will use a decision tree to examine a row of the table and to decide whether to give that person a net.</p> <p class=“task”><strong>Task</strong>: Open the <a href=“https://code.pyret.org/editor#share=1P8a1bN9VvrR-BndxADLMOs3gYwj_HWKi”>starter file</a> in CPO and select <em>File</em> → <em>Save a copy</em>.</p> <p>The code first loads the
train-data
and
test-data
tables from the spreadsheet. Note that it uses
num-sanitizer
to change the Boolean values into numbers – instead of
true
indicating someone is pregnant, now it’s
1
. This will be useful later!</p>
<p>Now let’s consider the data definition for a decision tree:</p>
<pre class=“pyret”><span class=“keyword”>data</span> <span class=“name”>DecisionTree</span>:
| decision(answer :: Boolean)
| question(
    column :: String,
    threshold :: Number,
    less-than-branch :: DecisionTree,
    greater-eq-branch :: DecisionTree)
<span class=“keyword”>end</span> </pre>
<p>This says that a decision tree is either</p> <ol> <li><p>a
decision
whose answer is
true
or
false
</p></li> <li><p>a
question
: How does the value in the specified
column
compare to some
threshold
? If it’s less than the threshold, we should follow the first branch of the tree. Otherwise, we should follow the second.</p></li> </ol> <p>So, to give a simple example, a
DecisionTree
for whether to wear a coat based on the temperature might be</p> <pre class=“pyret”>question(
"temperature"
, 55,
decision(<code class="constant">true</code>),
decision(<code class="constant">false</code>))
</pre> <p>That is, if it’s less than 55 °F, wear a coat. If not, don’t!</p> <p>Let’s make a first decision tree for whether to give a bed net to prevent malaria.</p>
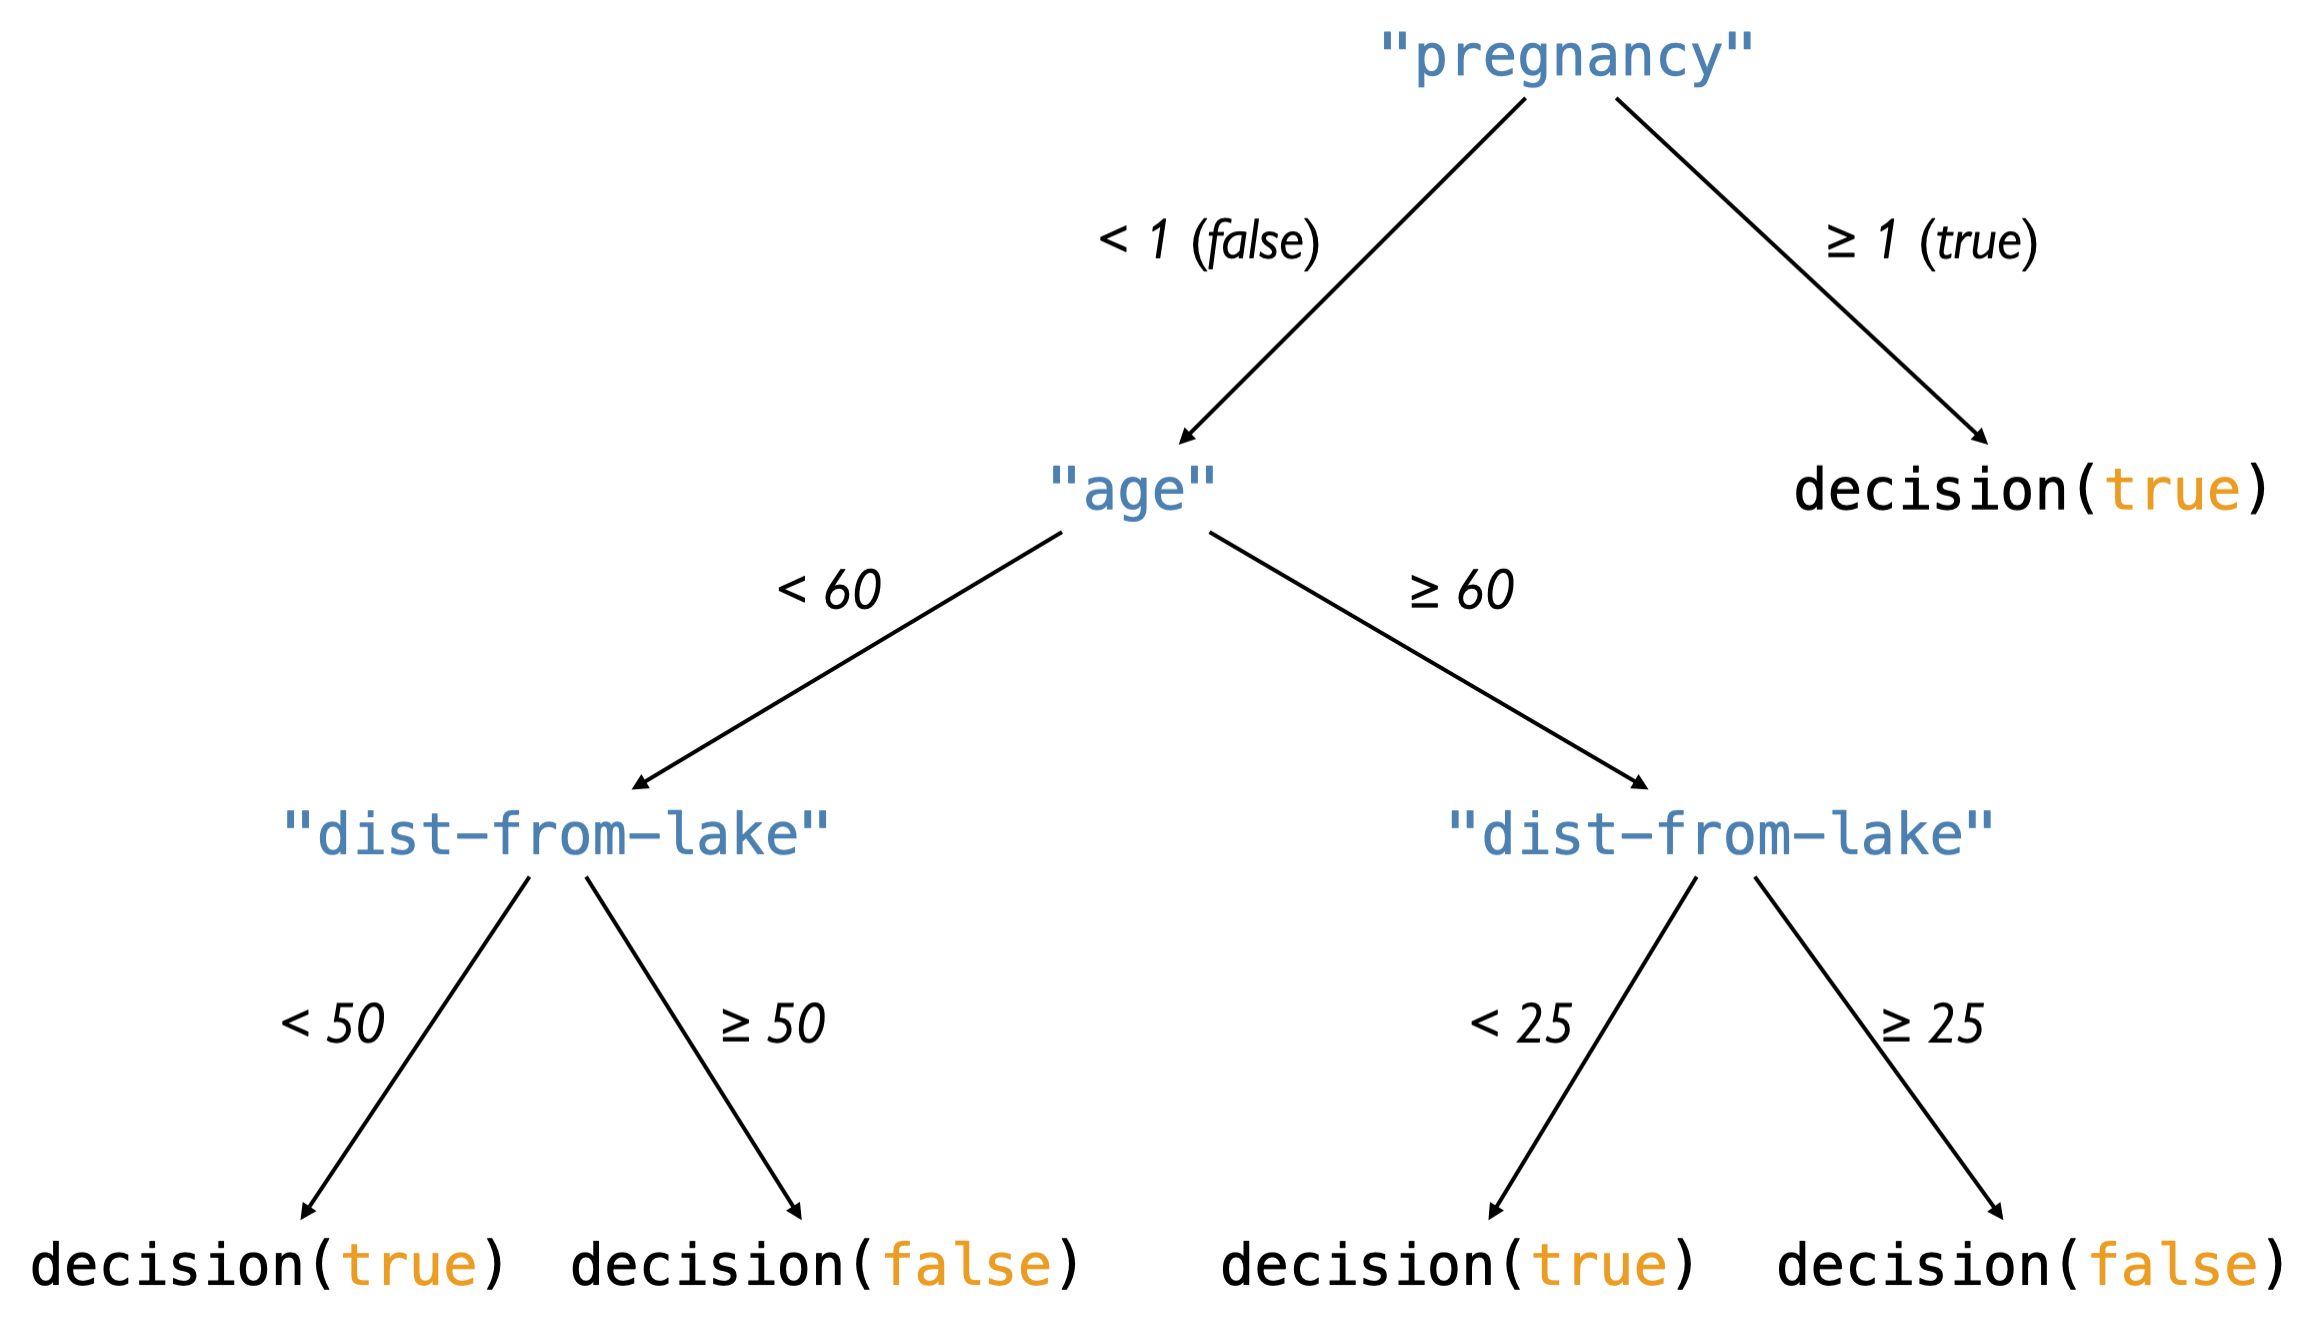
<div class=“task”> <p><strong>Task</strong>: Define
net-dt
to represent this
DecisionTree
:</p> <blockquote> <p><img src=“https://www.cs.vassar.edu/~cs101/images/diagram.png” /></p> </blockquote> </div>
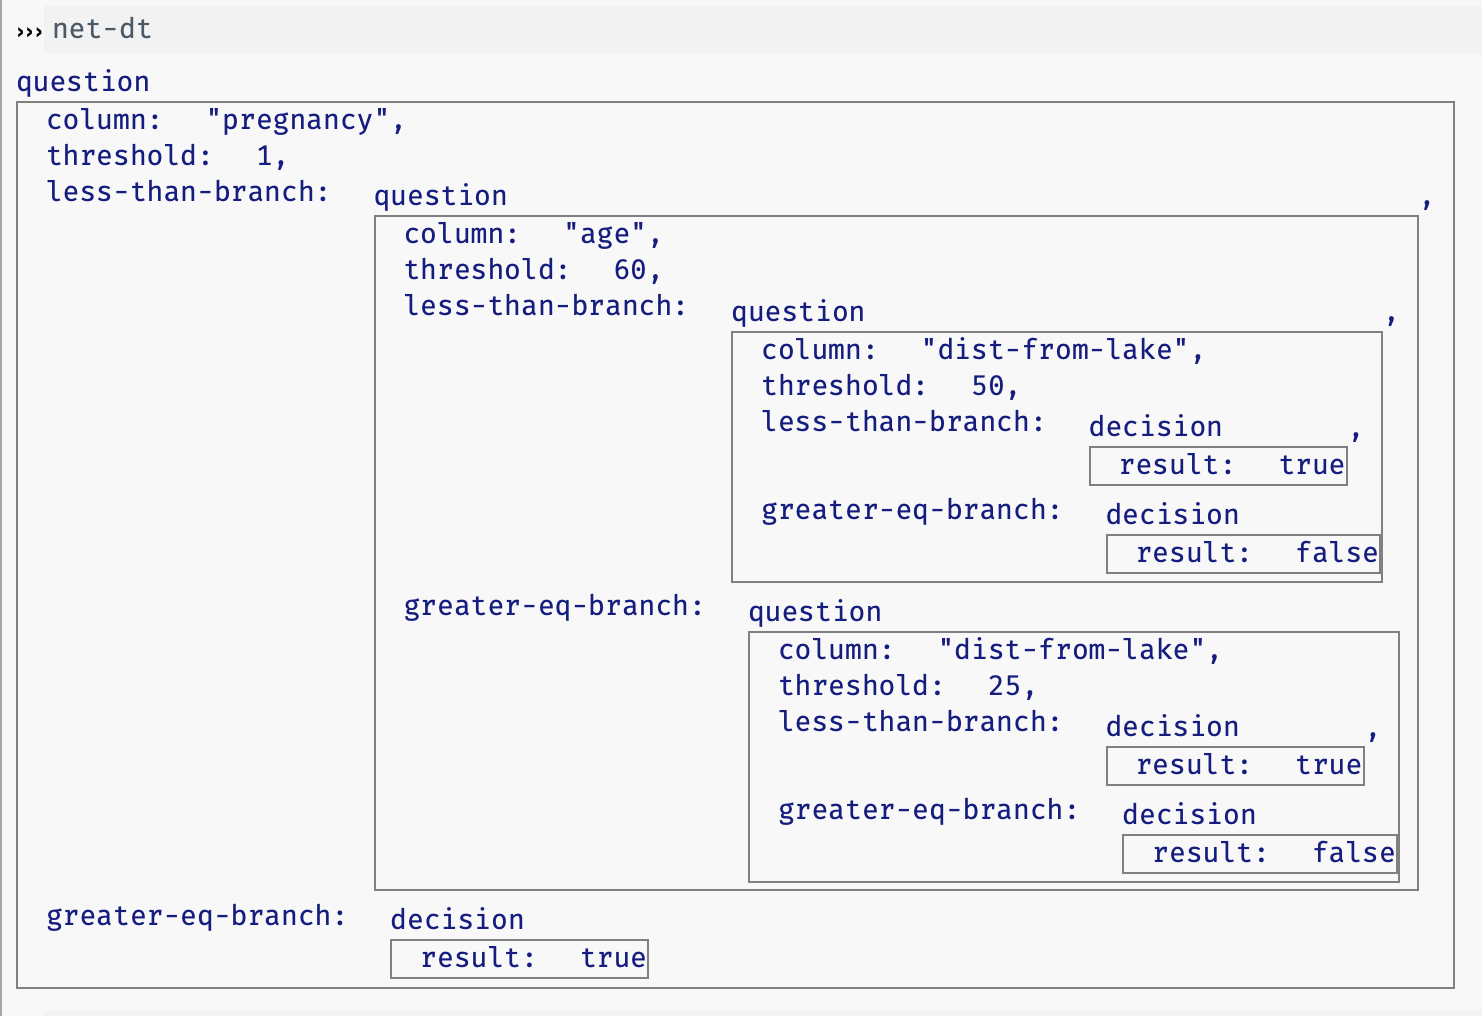
<p>Run your code, then examine
net-dt
in the interactions pane, clicking on the different parts. It should look like this:</p> <blockquote> <p><img src=“https://www.cs.vassar.edu/~cs101/images/part-1-tree.png” /></p> </blockquote>
<div class=“task”> <p><strong>Task</strong>: Starting with the provided template (
dt-fun
), define a function</p> <pre class=“pyret”>
fun
give-net
(dt :: DecisionTree, r :: Row) -> Boolean:
...
end
</pre>
<p>that uses the given decision tree to decide whether the person in row
r
should get a net.</p> </div> <ul> <li>If
dt
is a
decision
, then
give-net
should return its value (
true
or
false
).</li> <li>If
dt
is a
question
, then
give-net
should compare the value in the given column to the threshold, and then recursively examine either <ul> <li>the
less-than-branch
(if the column value is less than the threshold) or</li> <li>the
greater-eq-branch
(if the column value is greater than or equal to the threshold).</li> </ul></li> </ul> <p>To test your function (in a
where
block), you should define a small example table with values that lead to each of the five decision nodes in the tree.</p> <h2 id=“part-2-learning-a-decision-tree-from-data”>Part 2: Learning a decision tree from data</h2> <p>In Part 1, we built and used a decision tree to decide who should get bed nets, but the thresholds in that decision tree were arbitrary. Now we’ll build a better tree by learning appropriate thresholds from our training data.</p> <p>Here’s a way we could learn what distance from a lake is close enough that someone should get a net:</p> <ul> <li><p>We can filter the table to get a table of people who got malaria and a table of people who didn’t.</p></li> <li><p>Then we can compute the average distance from a lake for the people in each table.</p></li> <li><p>An appropriate threshold would then be halfway between these two averages.</p></li> </ul> <div class=“task”> <p><strong>Task</strong>: Use a similar process to compute three new thresholds based on
train-data
:</p> <ul> <li>
age-thresh
, halfway between the average age for non-pregnant people with malaria and non-pregnant people without malaria,</li> <li>
dist-thresh-young
, halfway between the average
dist-from-lake
of non-pregnant people younger than
age-thresh
, with/without malaria, and</li> <li>
dist-thresh-old
, halfway between the average
dist-from-lake
of non-pregnant people who are at least as old as
age-thresh
, with/without malaria.</li> </ul> </div> <p>Notice that to find these three thresholds, you’ll be repeating the same steps, just with different tables and columns. You can do these three steps manually to compute each threshold, but I recommend writing a function to do it for you:</p> <pre class=“pyret”>
fun
find-separator
(col :: String, t :: Table) -> Number:
<code class="keyword">doc</code>: <code class="string">"Return a number halfway between the average values of column `col` among people who got malaria and the average values of column `col` among people who did not get malaria"</code> ...
end
</pre>
<p>If you write
find-separator
, you don’t need to give test cases for it.</p> <p class=“task”><strong>Task</strong>: Next, build a new
DecisionTree
,
net-dt-learned
, that is the same as
net-dt
, except that it uses these new threshold values.</p> <p>Great! Or is it?</p> <p>To know if the
DecisionTree
we learned using
train-data
is any better than the one we started with, we should evaluate them both on a different set of data – namely, our
test-data
.</p>
<div class=“task”> <p><strong>Task</strong>: Make a table called
results1
by adding a new column called
predicted
to the
test-data
table. This new column should have the results of running the
give-net
function with
DecisionTree
net-dt
on each row.</p> <p><strong>Hint</strong>: Use a lambda expression so you can provide both arguments to
give-net
.</p> </div>
<p class=“task”><strong>Task</strong>: Make a table called
results2
, where the predicted column is computed using
net-dt-learned
.</p> <p>There are many ways to evaluate predictions, but the most common is called an <a href=“https://en.wikipedia.org/wiki/F-score”>F1 score</a>, which balances our desire for high <em>precision</em> (only giving nets to those who actually need them) with our desire for high <em>recall</em> (give nets to <em>everyone</em> who needs one).</p> <p>The following function will compute the F1 score for a table, using the value in the
contracted-malaria
column and in the new
predicted
column:</p>
<pre class=“pyret”>
fun
f1-score
(t :: Table) -> Number:
<code class="keyword">doc</code>: <code class="string">"Return the F1 score for a table of data with predictions"</code>
<var>true-pos</var> = filter-with(t, <code class="keyword">lam</code>(r): r[<code class="string">"contracted-malaria"</code>] <code class="keyword">and</code> r[<code class="string">"predicted"</code>] <code class="keyword">end</code>).length() <var>false-pos</var> = filter-with(t, <code class="keyword">lam</code>(r): not(r[<code class="string">"contracted-malaria"</code>]) <code class="keyword">and</code> r[<code class="string">"predicted"</code>] <code class="keyword">end</code>).length() <var>false-neg</var> = filter-with(t, <code class="keyword">lam</code>(r): r[<code class="string">"contracted-malaria"</code>] <code class="keyword">and</code> not(r[<code class="string">"predicted"</code>]) <code class="keyword">end</code>).length()
true-pos / (true-pos + (1/2 * (false-pos + false-neg)))
end
</pre>
<p class=“task”><strong>Task</strong>: Run
f1-score
on
results1
and on
results2
. Which has a higher score?</p> <h2 id=“submitting-the-assignment”>Submitting the assignment</h2> <ol> <li><p>Download your file (<em>File</em> → <em>Download</em>) and ensure it’s named
asmt06.arr
.</p></li> <li><p>Upload your assignment on <a href=“https://www.gradescope.com”>Gradescope</a>.</p></li> </ol> <p><strong>Note</strong>: You can submit as many times as you want before the deadline. Only your latest submission will be graded.</p> <h2 id=“acknowledgments”>Acknowledgments</h2> <p>This assignment contains material adapted from Phyllis Frankl.</p> </html>