<html> <style type=“text/css”> .comment { font-style: italic; color: #c0342d; } .name, .variable, code var, pre var { color: #9e5cb1; } .name { font-weight: bold; } .variable, pre var, code var { font-style: italic; } .keyword { color: #abafb3; } .builtin, .string { color: #417fb8; } .constant { color: #e89f27; } code.pyret { color: black; } table { margin: 1em auto; } table th, table td { padding: 1pt 4pt; } div.dw-content a { text-decoration: underline; } div.dw-content p, div.dw-content li, div.dw-content li p { font-size: 13pt; margin-bottom: 1em; max-width: 750px; } p code, li code { font-size: 11pt; } blockquote { font-size: inherit; } pre kbd, code kbd { background: inherit; color: inherit; box-shadow: none; padding: 0; font: inherit; font-weight: bold; } a.secret { color: inherit; text-decoration: none !important; } a.secret:hover { text-decoration: underline !important; } ol li div.task p:first-child {
margin: 0;
} div.task, p.task {
  background-color: #f2d4d7 !important;
  border: 1px solid #6366a !important;
  padding: 1em 2.25em;
  margin: 2em 1.5em;
} p.task, div.task p:first-child {
text-indent: -1.5em;
}
blockquote {
  border: 0;
  margin: 1.5rem;
} </style>
<h1 id=“lab-5-squirrel-data-analysis”>Lab 5: Squirrel Data Analysis</h1> <p>7 October 2022</p>
<h2 id=“learning-objective”>Learning objective</h2> <p>The goal of this lab is to give you practice working to analyze real data, which will require working with both tables and lists. As you work on each part of the lab, you’ll practice breaking problems into smaller tasks, which you can complete by writing functions and expressions.</p>
<hr style=“margin-top: 3em” />
<p>This lab can be completed in pairs!</p> <p>If you choose to work in a pair, you’ll make a single code file which you’ll upload to Gradescope with both your names.</p> <p>As you work through the lab, take turns “driving” and “navigating”. That is, for a while you type in CPO while your partner is reading the assignment and then you trade.</p>
<hr style=“margin-bottom: 3em” />
<h2 id=“introduction”>Introduction</h2> <p>Hundreds of volunteers have devoted their time to creating an important data set: the <a href=“https://www.thesquirrelcensus.com”>Squirrel Census</a>! This has involved carefully recording individual squirrel sightings, including information about the appearance of the squirrel, where it was seen, and what it was doing.</p> <p>While no census has (yet) been held for Vassar’s bold and bountiful squirrel population, in October 2018, the volunteers <a href=“https://www.centralparksquirrelcensus.com”>counted the squirrels in New York City’s Central Park</a>. This data set is published <a href=“https://data.cityofnewyork.us/Environment/2018-Central-Park-Squirrel-Census-Squirrel-Data/vfnx-vebw”>on the NYC Open Data</a> website, and in this lab we will use what we know about tables, lists, and functions to visualize these squirrel sightings.</p>
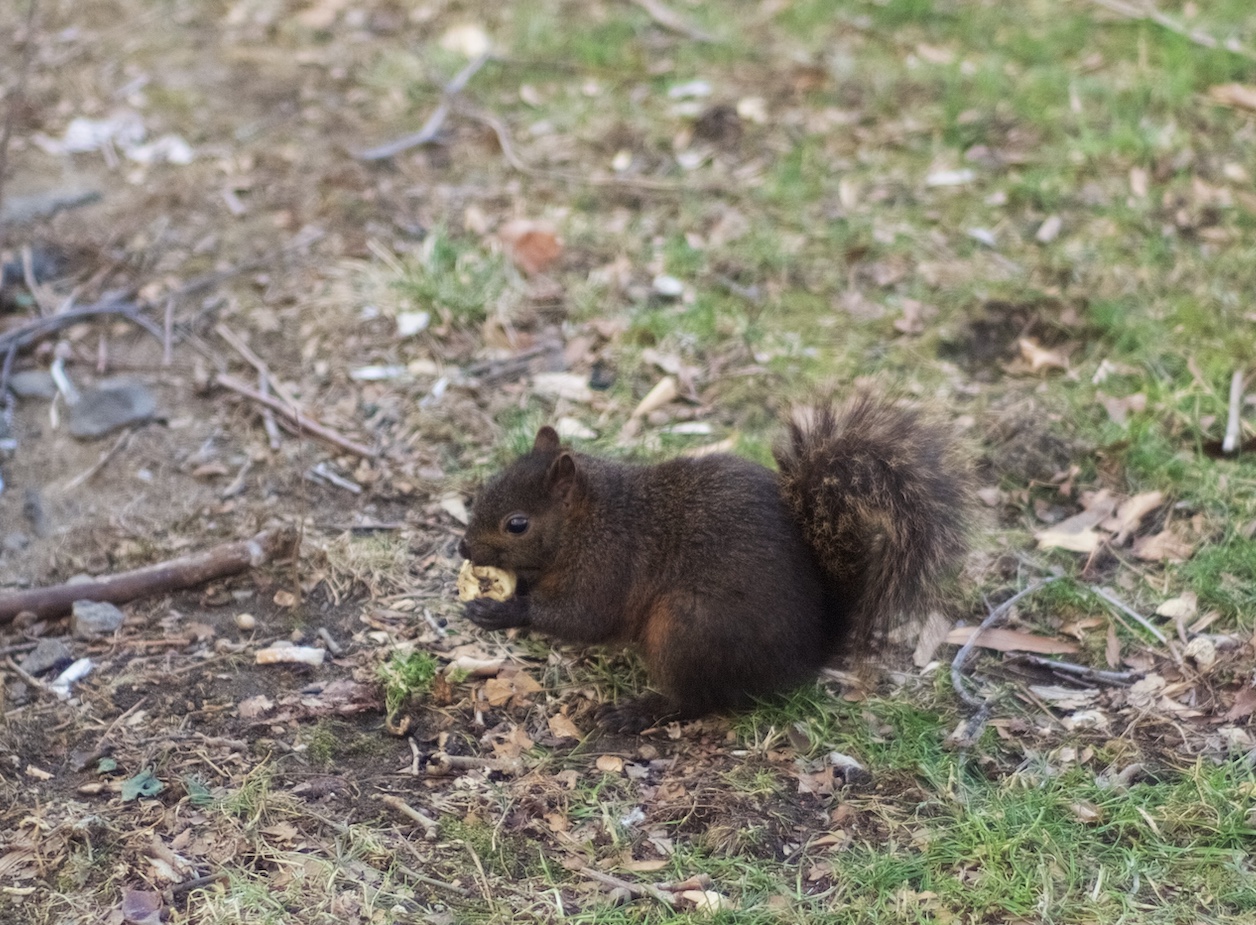
<blockquote> <img src=“https://www.cs.vassar.edu/~cs101/images/squirrel.jpg” alt=“Squirrel photo” style=“width: 500px”>
<p>A Central Park squirrel – or is it a data point? – spotted by Prof. Gordon</p> </blockquote>
<h2 id=“getting-started”>Getting started</h2>
<p>Before you start working with the data, take a look at the <a href=“https://docs.google.com/spreadsheets/d/1SaeGoEMzTXCmI2gy5E785M9tjEaRhfd6SeCn8lqW07I/edit?usp=sharing”>Google sheet</a> we’ve prepared containing the squirrel census data. The first sheet is the original data set, and the second sheet is a pruned version removing the columns that aren’t used for this lab.</p> <p>Load the pruned sheet into Pyret by pasting the following code into the definitions window:</p> <pre class=“pyret”><span class=“keyword”>include</span> gdrive-sheets <span class=“keyword”>include</span> data-source
<span class=“keyword”>include</span> shared-gdrive(<span class=“string”>"dcic-2021"</span>,
<span class="string">"1wyQZj_L0qqV9Ekgr9au6RX2iqt2Ga8Ep"</span>)
<span class=“keyword”>include</span> shared-gdrive(<span class=“string”>"lab05-helper.arr"</span>,
<span class="string">"1zpcjlBGMl4g34acSqU-P-VJ9rbZhNyDQ"</span>)
<span class=“comment”># # Load table #</span>
<var>ssid</var> = <span class=“string”>"1SaeGoEMzTXCmI2gy5E785M9tjEaRhfd6SeCn8lqW07I"</span> <var>data-sheet</var> = load-spreadsheet(ssid)
<var>squirrel-data</var> =
<span class="keyword">load-table</span>: long, lat, primary-color, location, activities, interactions <span class="keyword">source</span>: data-sheet.sheet-by-name(<span class="string">"Pruned"</span>, <span class="constant">true</span>) <span class="keyword">sanitize</span> primary-color <span class="keyword">using</span> string-sanitizer <span class="keyword">sanitize</span> location <span class="keyword">using</span> string-sanitizer <span class="keyword">sanitize</span> activities <span class="keyword">using</span> string-sanitizer <span class="keyword">sanitize</span> interactions <span class="keyword">using</span> string-sanitizer <span class="keyword">end</span>
</pre>
<h2 id=“part-1-mapping-squirrels”>Part 1: Mapping squirrels</h2>
<p>The
lab05-helper.arr
file we loaded above provides the function</p> <blockquote> <p>
table-to-map(t :: Table) -> Image
,</p> </blockquote> <p>which takes in a table and, for each row, plots a dot on a map of Central Park, using the values in the
"x"
,
"y"
, and
"color"
columns. You can use
table-to-map
just as you’ve used Pyret’s built-in functions in previous labs.</p> </blockquote>
<p>However, for
table-to-map
to plot a location, it needs appropriate
x
and
y
values that fall within the bounds of the map of Central Park. Thus you need to scale the squirrels’ latitudes to
y
values and their longitudes to
x
values, relative to the map dimensions.</p>
<p>The values you need to use (defined for you in
lab05-helper.arr
) are:</p>
<ul> <li><p>
LAT-MIN
: the minimum latitude that fits the map</p></li> <li><p>
LAT-MAX
: the maximum latitude that fits the map</p></li> <li><p>
LON-MIN
: the minimum longitude that fits the map</p></li> <li><p>
LON-MAX
: the maximum longitude that fits the map</p></li> <li><p>
HEIGHT
: the height of the map</p></li> <li><p>
WIDTH
: the width of the map</p></li> </ul> <p>And the scaling formulas you need to implement are:</p>
<blockquote> <p><img src=“https://render.githubusercontent.com/render/math?math=x%20=%20\frac{\textrm{WIDTH}}{\textrm{LON-MAX}%20-%20\textrm{LON-MIN}}%20\cdot%20(\textrm{longitude}%20-%20\textrm{LON-MIN})” alt=“formula for x” style=“height: 32px” /></p> </blockquote>
<blockquote> <p><img src=“https://render.githubusercontent.com/render/math?math=y%20=%20\frac{\textrm{HEIGHT}}{\textrm{LAT-MAX}%20-%20\textrm{LAT-MIN}}%20\cdot%20(\textrm{latitude}%20-%20\textrm{LAT-MIN})” alt=“formula for y” style=“height: 32px” /></p> </blockquote>
<div class=“task”> <p><strong>Task</strong>: Define the function</p> <pre class=“pyret”><span class=“keyword”>fun</span> <span class=“name”>add-coords</span>(squirrels :: Table) -> Table:
...
<span class=“keyword”>end</span> </pre> <p>That adds
"x"
and
"y"
columns to the table with the values calculated by the scaling formulas.</p> </div>
<p>You will need to write (simple) helper functions to do this!</p>
<p>To test your function, you can use the following before-and-after tables:</p> <pre class=“pyret”><var>test-table-coords</var> =
<span class="keyword">table</span>: long, lat
  <span class="keyword">row</span>: -73.95613449, 40.79408239
  <span class="keyword">row</span>: -73.96885747, 40.78378252
<span class="keyword">end</span>
<var>test-table-coords-x-y</var> =
<span class="keyword">table</span>: long, lat, x, y
  <span class="keyword">row</span>: -73.95613449, 40.79408239, 3117716037/3380000, 352525149/260000
  <span class="keyword">row</span>: -73.96885747, 40.78378252, 1607498311/3380000, 57342033/65000
<span class="keyword">end</span>
</code></pre>
<p>Let’s check if these coordinates look right! To do that, we need a column giving the color for each point on the map. For the moment, let’s just paint it black:</p>
<div class=“task”> <p><strong>Task</strong>: Add a column labeled
"color"
and set each row’s color to
"black"
.</p>
<p>You don’t need to define <em>any</em> functions to do this if you use a <a href=“https://dcic-world.org/2022-01-25/tables-to-lists.html#%28part._.Lambda__.Anonymous_.Functions%29”>lambda expression</a>!</p> </div>
<p>Run
table-to-map
on your table after you add the
"x"
,
"y"
, and
"color"
columns. You should see a map that looks like this:</p>
<p style=“text-align: center”><img src=“https://www.cs.vassar.edu/~cs101/images/map.png” alt=“map” /></p>
<p>Note that the squirrels are approximately contained within Central Park and they’re not in the water!</p> <p>There are 3,023 rows in this table, so it may take a few seconds to plot.</p>
<hr style=“margin-top: 3em” />
<p><strong>Checkpoint</strong>: Call over a coach when you reach this point. After they check your work, you can comment out the expressions for plotting the squirrels as black dots.</p>
<hr style=“margin-bottom: 3em” />
<h2 id=“part-2-squirrel-colors”>Part 2: Squirrel colors</h2>
<p>Now that you have a map of <em>where</em> the squirrels were sighted, it’s time to investigate other observations in the data set. One piece of information the volunteers recorded is the primary fur color of each squirrel. Let’s update our map to show each squirrel’s color.</p>
<div class=“task”> <p><strong>Task</strong>: Write a function</p> <pre class=“pyret”><span class=“keyword”>fun</span> <span class=“name”>map-squirrel-colors</span>(squirrels :: Table) -> Image:
...
<span class=“keyword”>end</span> </pre> <p>that draws the same map as before, but with the dot for each squirrel matching the color of its fur, recorded in the
"primary-color"
column.</p> </div>
<p>Note that
"Cinnamon"
isn’t a <a href=“https://www.pyret.org/docs/latest/color.html#%28part._s~3acolor-constants%29”>color Pyret knows</a>, so you should change it to
"brown"
. If there’s no recorded fur color for a squirrel, use a white dot.</p>
<p>As before, you may need to define helper functions.</p> <p>What do you observe about the distribution of fur color on the map?</p>
<hr style=“margin-top: 3em” />
<p><strong>Checkpoint</strong>: Call over a coach when you reach this point.</p>
<hr style=“margin-bottom: 3em” />
<h2 id=“part-3-describing-squirrels”>Part 3: Describing squirrels</h2>
<p>While the fur colors in the census data from from a mixed set of possible values, there are three interesting fields of “free text” input:</p> <ul> <li>“Other Activities” (
"activities"
in our table),</li> <li>“Other Interactions” (
"interactions"
), and</li> <li>“Specific Location” (
"location"
).</li> </ul> <p>While these fields give us observations that wouldn’t otherwise fit in the data, they’re not as easy to process.</p>
<p>Rather than try to process these values in the table itself, let’s pull them out and get a list of all the free-text observations.</p>
<div class=“task”> <p><strong>Task</strong>: Write a function</p> <pre class=“pyret”><span class=“keyword”>fun</span> <span class=“name”>get-all-observations</span>(squirrels :: Table) -> List<String>:
...
<span class=“keyword”>end</span> </pre> <p>that returns a list of all the observation strings from the three columns listed above.</p> <p>Additionally, you should remove observations that are blank (
""
) and should make all of the strings lowercase.</p> </div>
<p>To do this, you don’t need to write a recursive function – instead, think how you can use Pyret’s built-in list functions:</p> <ul> <li>
append
(or
+
),</li> <li>
map
(which is the list equivalent of
transform-column
), and</li> <li>
filter
(which is the list equivalent of
filter-with
).</li> </ul> <p>You can test your function with the following table and list:</p> <pre class=“pyret”><var>test-str-table</var> =
<span class="keyword">table</span>: activities, interactions, location <span class="keyword">row</span>: <span class="string">"Eating a nut"</span>, <span class="string">""</span>, <span class="string">""</span> <span class="keyword">row</span>: <span class="string">""</span>, <span class="string">"Said hi"</span>, <span class="string">"In a tree"</span> <span class="keyword">end</span>
<var>test-str-list</var> =
[<span class="keyword">list</span>: <span class="string">"eating a nut"</span>, <span class="string">"said hi"</span>, <span class="string">"in a tree"</span>]
</pre>
<p>You should now have a list of all the observations. (My favorite is
"playing tag"
!) But it’s still hard to analyze. To get a better feel for what’s in these strings, let’s divide them into words.</p>
<div class=“task”> <p><strong>Task</strong>: Call the function
split-all
(defined for you in
lab05-helper.arr
) on your list of strings. This will give you a list of individual words.</p> </div>
<p>Check that it works by using <a href=“https://www.pyret.org/docs/latest/lists.html#%28idx._%28gentag._228%29%29”>
.member
</a> to check if a word is in the list.</p>
<p>And now it’s possible to count how many times each word occurs in the data.</p>
<div class=“task”> <p><strong>Task</strong>: Call the function
count-list
(also defined for you in
lab05-helper.arr
) on your list of words.</p>
<p>What is the most frequent word?</p> </div>
<h2 id=“submitting-the-lab”>Submitting the lab</h2>
<ul> <li><p>When you’ve completed the exercises, show your code to your instructor or one of the coaches.</p></li> <li><p>Then upload your
lab05.arr
file to the Lab 5 assignment on <a href=“https://www.gradescope.com”>Gradescope</a>.</p></li> </ul>
<h2 id=“acknowledgments”>Acknowledgments</h2> <p>This lab uses data from the <a href=“https://www.thesquirrelcensus.com”>Squirrel Census</a> and includes material adapted from Kathi Fisler and colleagues at Brown University.</p> </html>